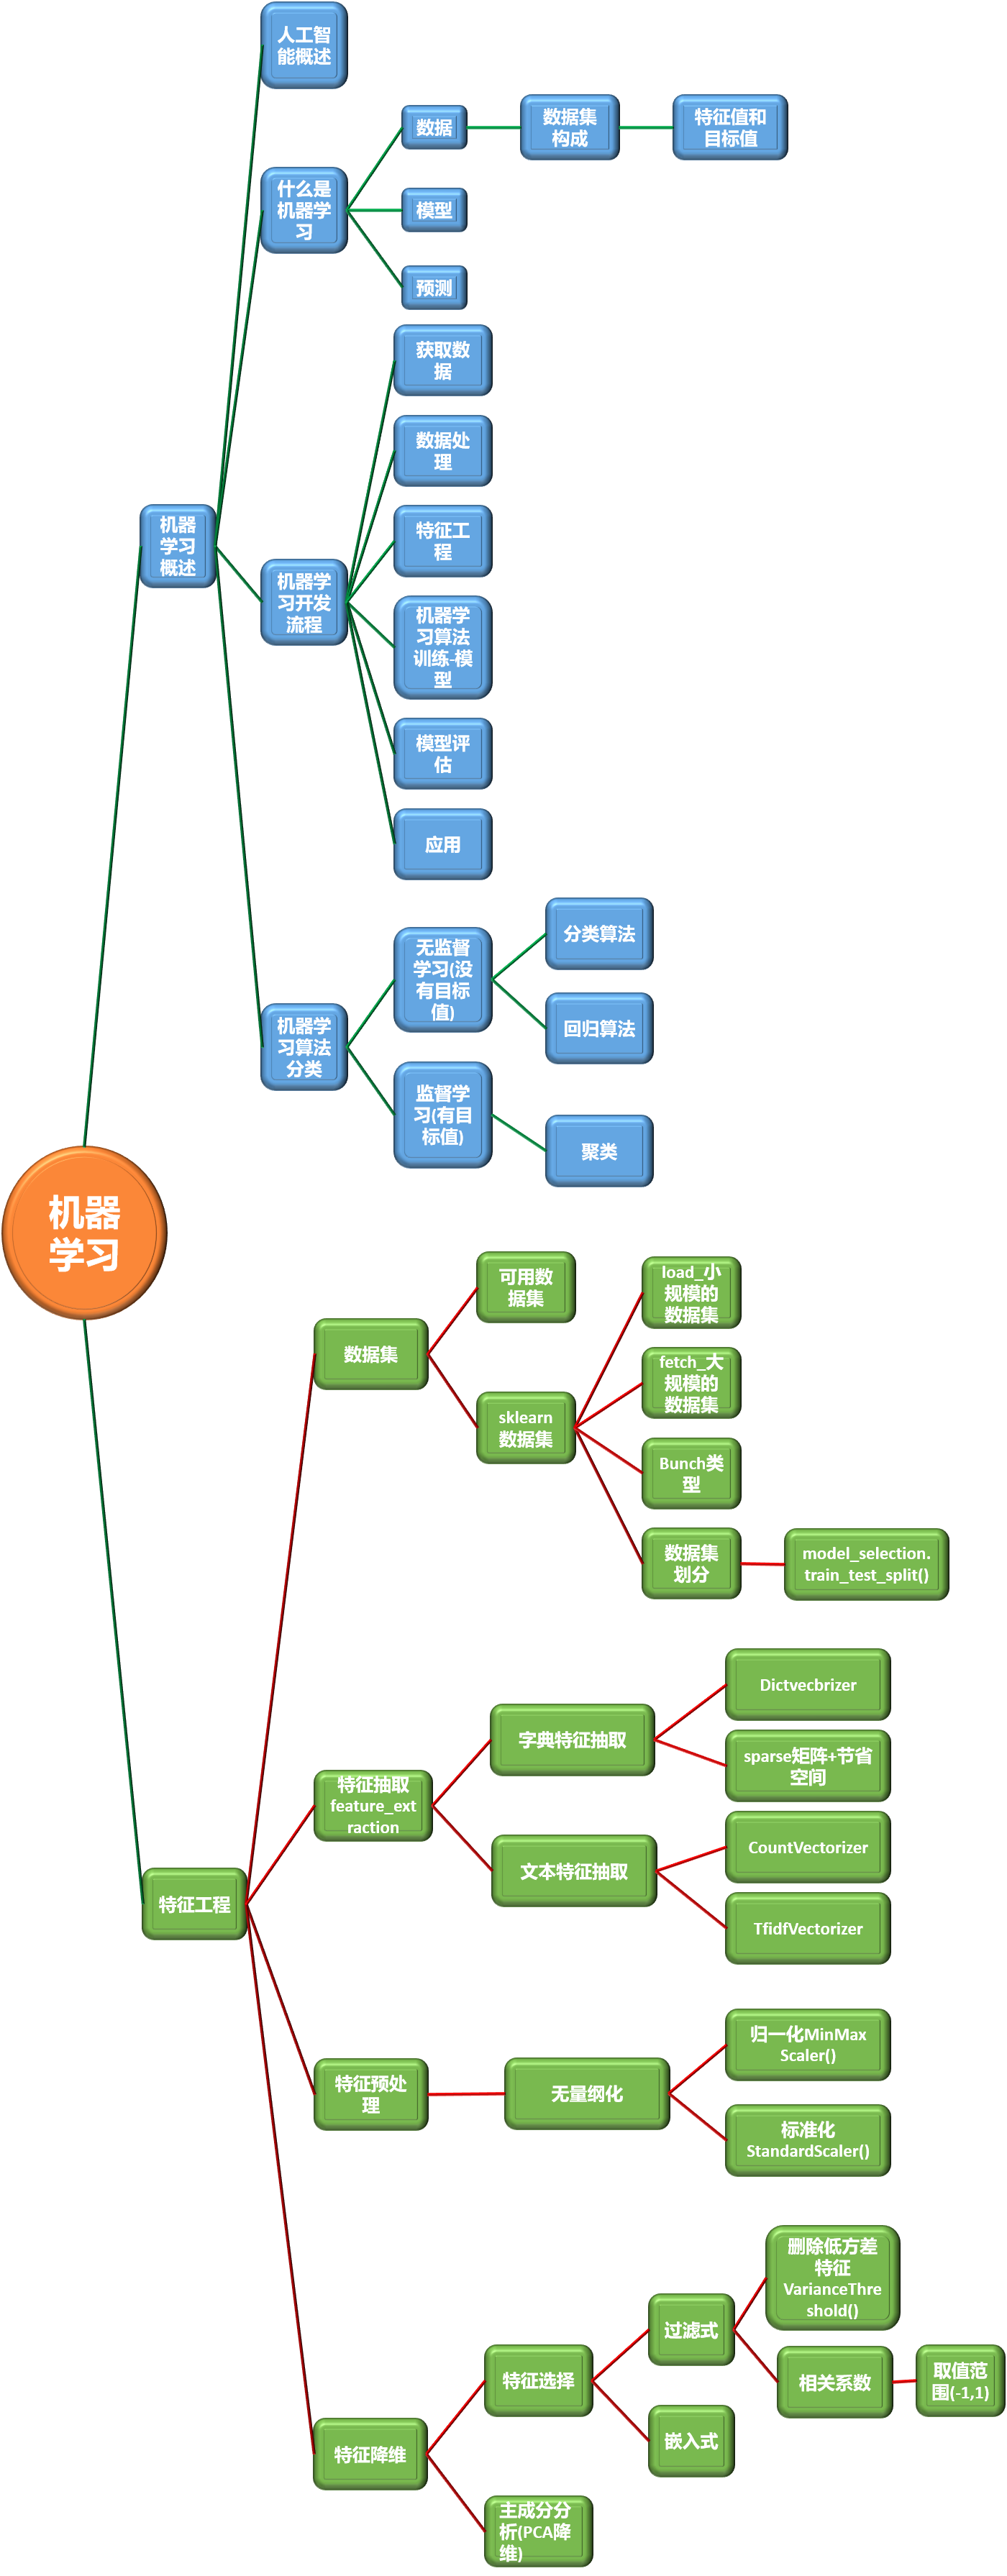
机器学习(二)入门
from sklearn.datasets import load_iris
from sklearn.model_selection import train_test_split

def datasets_demo():
    """
    sklearn 数据集使用
    return:
    """
    iris = load_iris()
#     print("鸢尾花数据集:\n", iris)
#     print("查看数据集描述:\n", iris["DESCR"])
#     print("查看特征值的名字:\n", iris.feature_names)
    # 数据集划分
    x_train, x_test,y_train, y_test = train_test_split(iris.data, iris.target, test_size=0.2, random_state=22)
    print("训练集特征值:\n%s \n(特征值数量,样本数量)\n%s" % (x_train, x_train.shape))# 输出x_train.shape,特征值数量180个数据取120个,取0.8倍,样本数量不变
    return None

datasets_demo()
1.特征提取
sklearn. feature_ extraction
2.字典特征提取类别one-hot编码
sklearn. featureextraction. DictVectorisparse=true
vector数学:向量物理:矢量
矩阵 matrix二维数组
向量 vector一维数组
父类:转换器类
返回 sparse矩阵
sparse稀疏
将非零值按位置表示出来
节省内存提高加载效率
应用场景:
1) pclassse数据集当中类别特征比较多
1、将数据集的特征-》字典类型
2、 DictVectorizer转换
2)本身拿到的数据就是字典类型
from sklearn.feature_extraction import DictVectorizer
def dic_demo():
    """字典特征抽取"""
    data = [{'city':"北京","temperature": 100},{'city':"上海","temperature":60},{'city':"深圳","temperature": 30}]
    # 实例化一个转换器类
    transfer = DictVectorizer()
#     transfer = DictVectorizer(sparse=False)
    # 2。调用fit_transform()
    date_new = transfer.fit_transform(data)
    print("date_new\n", date_new)
    return None
dic_demo()
返回稀疏矩阵
date_new
(0, 1) 1.0
(0, 3) 100.0
(1, 0) 1.0
(1, 3) 60.0
(2, 2) 1.0
(2, 3) 30.0
8.3 文本特征提取
单词作为特征
句子、短语、单词、字母
特征:特征词
方法1: CountVectorizer
统计每个样本特征词出现的个数
文本特征抽取CountVectorizer
英文
from sklearn.feature_extraction.text import CountVectorizer
def count_demo():
    """
    文本特征抽取:CountVectorizer
    """
    date = ["life is short, i like like python", "life is too long, i dislike python"]
    # 1.实例化一个转换器
    transfer = CountVectorizer()
    # 2调用fit_transform
    date_new = transfer.fit_transform(date)
    print("data_new: \n", date_new)
    return None
count_demo()
data_new:
   (0, 2)	1
  (0, 1)	1
  (0, 6)	1
  (0, 3)	2
  (0, 5)	1
  (1, 2)	1
  (1, 1)	1
  (1, 5)	1
  (1, 7)	1
  (1, 4)	1
  (1, 0)	1
转成二维矩阵用.toarray()
data_new:
 [[0 1 1 2 0 1 1 0]
 [1 1 1 0 1 1 0 1]]
停用词:stop_words=['is', 'too']
import jieba
from sklearn.feature_extraction.text import CountVectorizer
def count_chinese_demo():
    text =    ["我们总是在意别人的言论,不敢做自己喜欢的事情,害怕淹没在飞短流长之中。","其实没有人真的在乎你在想什么,不要过高估量自己在他人心目中的地位。","被别人议论甚至误解都没啥,谁人不被别人说,谁人背后不说人,你生活在别人的眼神里,就迷失在自己的心路上"]
    date_list = []
    for sent in text:
        date_list.append(' '.join(list(jieba.cut(sent))))

    # 1.实例化一个转换器
    transfer = CountVectorizer(stop_words=['不要', '什么'])
    # 2调用fit_transform
    date_new = transfer.fit_transform(date_list)
    print("data_new: \n", date_new)
    print("特征名字: \n", transfer.get_feature_names())
    return None

count_chinese_demo()
data_new:
   (0, 14)	1
  (0, 13)	1
  (0, 9)	1
  (0, 6)	1
  (0, 23)	1
  (0, 0)	1
  (0, 22)	1
  (0, 7)	1
  (0, 2)	1
  (0, 11)	1
  (0, 16)	1
  (0, 29)	1
  (0, 1)	1
  (1, 22)	1
  (1, 5)	1
  (1, 15)	1
  (1, 19)	1
  (1, 8)	1
  (1, 27)	1
  (1, 4)	1
  (1, 3)	1
  (1, 12)	1
  (1, 10)	1
  (2, 6)	3
  (2, 22)	1
  (2, 24)	1
  (2, 17)	1
  (2, 25)	1
  (2, 21)	1
  (2, 18)	1
  (2, 20)	1
  (2, 28)	1
  (2, 26)	1
特征名字:
 ['不敢', '之中', '事情', '他人', '估量', '其实', '别人', '喜欢', '在乎', '在意', '地位', '害怕', '心目', '总是', '我们', '没有', '淹没', '甚至', '生活', '真的', '眼神', '背后', '自己', '言论', '议论', '误解', '路上', '过高', '迷失', '飞短流长']
8.5 tf-idf
分类机器学习算法进行文章分类中前期数据处理方式
from sklearn.feature_extraction.text import TfidfVectorizer
import jieba
def tf_idf_demo():
    text =    ["我们总是在意别人的言论,不敢做自己喜欢的事情,害怕淹没在飞短流长之中。","其实没有人真的在乎你在想什么,不要过高估量自己在他人心目中的地位。","被别人议论甚至误解都没啥,谁人不被别人说,谁人背后不说人,你生活在别人的眼神里,就迷失在自己的心路上"]
    date_list = []
    for sent in text:
        date_list.append(' '.join(list(jieba.cut(sent))))

    # 1.实例化一个转换器
    transfer = TfidfVectorizer(stop_words=['不要', '什么'])
    # 2调用fit_transform
    date_new = transfer.fit_transform(date_list)
    print("data_new: \n", date_new.toarray())
    print("特征名字: \n", transfer.get_feature_names())
    return None

# Tf-idf方式进行特征抽取
tf_idf_demo()
data_new:
 [[0.28955446 0.28955446 0.28955446 0.         0.         0.
  0.22021363 0.28955446 0.         0.28955446 0.         0.28955446
  0.         0.28955446 0.28955446 0.         0.28955446 0.
  0.         0.         0.         0.         0.17101553 0.28955446
  0.         0.         0.         0.         0.         0.28955446]
 [0.         0.         0.         0.32705548 0.32705548 0.32705548
  0.         0.         0.32705548 0.         0.32705548 0.
  0.32705548 0.         0.         0.32705548 0.         0.
  0.         0.32705548 0.         0.         0.19316423 0.
  0.         0.         0.         0.32705548 0.         0.        ]
 [0.         0.         0.         0.         0.         0.
  0.61971882 0.         0.         0.         0.         0.
  0.         0.         0.         0.         0.         0.27161859
  0.27161859 0.         0.27161859 0.27161859 0.16042231 0.
  0.27161859 0.27161859 0.27161859 0.         0.27161859 0.        ]]
特征名字:
 ['不敢', '之中', '事情', '他人', '估量', '其实', '别人', '喜欢', '在乎', '在意', '地位', '害怕', '心目', '总是', '我们', '没有', '淹没', '甚至', '生活', '真的', '眼神', '背后', '自己', '言论', '议论', '误解', '路上', '过高', '迷失', '飞短流长']
1 定义
通过对原始数据进行变换把数据映射到(默认为[0,1)间
2 公式
\(x '=\frac{x-min}{max-min} ,x''=x'*(mx-mi)+mi\)
异常值:最大值、最小值
import pandas as pd
from sklearn.preprocessing import MinMaxScaler
def minmax_demo():
    """归一化"""
    # 1.获取数据
    data = pd.read_csv(r"F:\F盘\视频\Machine_Learning\resources\datingTestSet2.csv")

    # 行都要,列3行
    data = data.iloc[:, :3]
    print(data)
    # 2.实例化一个转换器类
    transfer = MinMaxScaler()
    # 3.调用fit_transform
    data_new = transfer.fit_transform(data)
    print("data_new\n", data_new)
minmax_demo()
     milage     Liters  Consumtime
0     40920   8.326976    0.953952
1     14488   7.153469    1.673904
2     26052   1.441871    0.805124
3     75136  13.147394    0.428964
4     38344   1.669788    0.134296
..      ...        ...         ...
995   11145   3.410627    0.631838
996   68846   9.974715    0.669787
997   26575  10.650102    0.866627
998   48111   9.134528    0.728045
999   43757   7.882601    1.332446

[1000 rows x 3 columns]
data_new
 [[0.44832535 0.39805139 0.56233353]
 [0.15873259 0.34195467 0.98724416]
 [0.28542943 0.06892523 0.47449629]
 ...
 [0.29115949 0.50910294 0.51079493]
 [0.52711097 0.43665451 0.4290048 ]
 [0.47940793 0.3768091  0.78571804]]
归一化总结
注意最大值最小值是变化的,另外,最大值与最小值非常容易受异常点影响,
所以这种方法鲁棒性较差,只适合传统精确小数据场景。
1.定义
通过对原始数据进行变换把数据变换到均值为0标准差为1范围内
2.公式
\(x' = \frac{x-mean}{\sigma}\)
3.代码
对于归一化来说:如果出现异常点影响了最大值和最小值,那么结果显然会发生改变
对于标准化来说:如果出现异常点由于具有一定数据量,少量的异常点
对于平均值的影响并不大,从而方差改变较小。
import pandas as pd
from sklearn.preprocessing import StandardScaler
def standard_demo():
    """标准化"""
    # 1.获取数据
    data = pd.read_csv(r"F:\F盘\视频\Machine_Learning\resources\datingTestSet2.csv")

    # 行都要,列3行
    data = data.iloc[:, :3]
    print(data)
    # 2.实例化一个转换器类
    transfer = StandardScaler()
    # 3.调用fit_transform
    data_new = transfer.fit_transform(data)
    print("data_new\n", data_new)
standard_demo()
     milage     Liters  Consumtime
0     40920   8.326976    0.953952
1     14488   7.153469    1.673904
2     26052   1.441871    0.805124
3     75136  13.147394    0.428964
4     38344   1.669788    0.134296
..      ...        ...         ...
995   11145   3.410627    0.631838
996   68846   9.974715    0.669787
997   26575  10.650102    0.866627
998   48111   9.134528    0.728045
999   43757   7.882601    1.332446

[1000 rows x 3 columns]
data_new
 [[ 0.33193158  0.41660188  0.24523407]
 [-0.87247784  0.13992897  1.69385734]
 [-0.34554872 -1.20667094 -0.05422437]
 ...
 [-0.32171752  0.96431572  0.06952649]
 [ 0.65959911  0.60699509 -0.20931587]
 [ 0.46120328  0.31183342  1.00680598]]
4.标准化总结
在已有样本足够多的情况下比较稳定,适合现代嘈杂大数据场景。
1. 降维是指在某些限定条件下,降低随机变量(特征个数,得到一组“不相关主变
量的过程
·降低随机变量的个数
2 相关系数
皮尔逊相关系数(Pearson Correlation Coefficient)
反映变量之间相关关系密切程度的统计指标
4.2.3特点
相关系数的值介于-1与+1之间,即-1srs+1。其性质如下:
当r>0时,表示两变量正相关,r<0时,两变量为负相关
当|r=1时,表示两变量为完全相关,当r=0时,表示两变量间无相关关系
当0<r<1时,表示两变量存在一定程度的相关且越接近1,两变量间线
性关系越密切;|r越接近于0,表示两变量的线性相关越弱
·一般可按三级划分:r<0.4为低度相关;0.4r<0.7为显著性相关;0.7sr
<1为高度线性相关
这个符号:r为r的绝对值,|-5|=5
from sklearn.feature_selection import VarianceThreshold
import pandas as pd
from scipy.stats import pearsonr
def variance_demo():
    """
    过滤方差特征
    """
    # 1.获取数据
    data = pd.read_csv(r"F:\F盘\视频\Python3天快速入门机器学项目资料\02-代码\factor_returns.csv")
    data = data.iloc[:, 1:-2]
    print("data:\n", data)

    # 2.实例化一个转换器类
    transfer = VarianceThreshold()
    # 3.调用fit_transform
    data_new = transfer.fit_transform(data)
    print("data_new:\n", data_new)
    # 计算某两个变量之间的相关系数
    r1 = pearsonr(data['pe_ratio'], data['pb_ratio'])
    print("相关系数:\n", r1)
    r2 = pearsonr(data['revenue'], data['total_expense'])
    print("revenue与total_expense之间的相关性\n", r2)
variance_demo()
data:
       pe_ratio  pb_ratio    market_cap  return_on_asset_net_profit  \
0       5.9572    1.1818  8.525255e+10                      0.8008
1       7.0289    1.5880  8.411336e+10                      1.6463
2    -262.7461    7.0003  5.170455e+08                     -0.5678
3      16.4760    3.7146  1.968046e+10                      5.6036
4      12.5878    2.5616  4.172721e+10                      2.8729
...        ...       ...           ...                         ...
2313   25.0848    4.2323  2.274800e+10                     10.7833
2314   59.4849    1.6392  2.281400e+10                      1.2960
2315   39.5523    4.0052  1.702434e+10                      3.3440
2316   52.5408    2.4646  3.287910e+10                      2.7444
2317   14.2203    1.4103  5.911086e+10                      2.0383

      du_return_on_equity            ev  earnings_per_share       revenue  \
0                 14.9403  1.211445e+12              2.0100  2.070140e+10
1                  7.8656  3.002521e+11              0.3260  2.930837e+10
2                 -0.5943  7.705178e+08             -0.0060  1.167983e+07
3                 14.6170  2.800916e+10              0.3500  9.189387e+09
4                 10.9097  8.124738e+10              0.2710  8.951453e+09
...                   ...           ...                 ...           ...
2313              15.4895  2.784450e+10              0.8849  1.148170e+10
2314               2.4512  3.810122e+10              0.0900  1.731713e+09
2315               8.0679  2.420817e+10              0.2200  1.789082e+10
2316               2.9202  3.883803e+10              0.1210  6.465392e+09
2317               8.6179  2.020661e+11              0.2470  4.509872e+10

      total_expense
0      1.088254e+10
1      2.378348e+10
2      1.203008e+07
3      7.935543e+09
4      7.091398e+09
...             ...
2313   1.041419e+10
2314   1.089783e+09
2315   1.749295e+10
2316   6.009007e+09
2317   4.132842e+10

[2318 rows x 9 columns]
data_new:
 [[ 5.95720000e+00  1.18180000e+00  8.52525509e+10 ...  2.01000000e+00
   2.07014010e+10  1.08825400e+10]
 [ 7.02890000e+00  1.58800000e+00  8.41133582e+10 ...  3.26000000e-01
   2.93083692e+10  2.37834769e+10]
 [-2.62746100e+02  7.00030000e+00  5.17045520e+08 ... -6.00000000e-03
   1.16798290e+07  1.20300800e+07]
 ...
 [ 3.95523000e+01  4.00520000e+00  1.70243430e+10 ...  2.20000000e-01
   1.78908166e+10  1.74929478e+10]
 [ 5.25408000e+01  2.46460000e+00  3.28790988e+10 ...  1.21000000e-01
   6.46539204e+09  6.00900728e+09]
 [ 1.42203000e+01  1.41030000e+00  5.91108572e+10 ...  2.47000000e-01
   4.50987171e+10  4.13284212e+10]]
相关系数:
 (-0.004389322779936263, 0.8327205496564927)
revenue与total_expense之间的相关性
 (0.9958450413136115, 0.0)
PCA降维
什么是主成分分析(PCA)
·定义:高维数据转化为低维数据的过程,在此过程中可能会舍弃原有数据、创造新的变量
·作用:是数据维数压缩,尽可能降低原数据的维数(复杂度),损失少量信息。
应用:回归分析或者聚类分析当中
from sklearn.decomposition import PCA
def pca_demo():
    """PCA降维"""
    data = [[2,8,4,5], [6,3,0,8], [5,4,9,1]]
    # 1.实例化一个转换器类,n_components小数时候0.95保留95%的特征, 整数时候2时候保留2个特征
    transfer = PCA(n_components=0.95)
    # 2.调用fit_transform
    data_new = transfer.fit_transform(data)
    print("data_new:\n", data_new)
pca_demo()
data_new:
 [[ 1.28620952e-15  3.82970843e+00]
 [ 5.74456265e+00 -1.91485422e+00]
 [-5.74456265e+00 -1.91485422e+00]]
9.1 K-近邻算法(KNN)原理
Nearest Neighbor算法又叫KNN算法,这个算法是机器学习里面一个比较经典的算法,总体来说KNN算法是相对比较容易理解的算法
定义
如果一个样本在特征空间中的k个最相似(即特征空间中最邻近)的样本中的大多数属于某一个类别,则该样本也属于这个类别
来源:KNN算法最 Cover早是由和art提出的一种分类算法
·距离公式
两个样本的距离可以通过如下公式计算,又叫欧式距离
比如说,a(a,a2,a3),b(b1,b2,b3)
\(\sqrt{(a1-b1)^2+(a2-b2)^2+(a3-b3)^2}\)
from sklearn.datasets import load_iris
from sklearn.model_selection import train_test_split
from sklearn.preprocessing import StandardScaler
from sklearn.neighbors import KNeighborsClassifier
def knn_iris():
    """用knn算法对鸢尾花进行分类"""
    # 1)获取数据
    iris = load_iris()
    # 2)划分数据集
    x_train, x_test, y_train, y_test = train_test_split(iris.data, iris.target, random_state=6)
    # 3)特征工程:标准化
    transfer = StandardScaler()
    x_train = transfer.fit_transform(x_train)
    # 对训练集标准化
    x_test = transfer.transform(x_test)
    # 4)KNN算法预估器
    estimator = KNeighborsClassifier(n_neighbors=3)
    estimator.fit(x_train, y_train)
    # 5)模型评估
    # 方法1:直接比对真实值和预测值
    y_predict = estimator.predict(x_test)
    print("y_predict:\n", y_predict)
    print("直接对比真实值和预测值:\n", y_test==y_predict)
    # 方法2:计算准确率
    score = estimator.score(x_test, y_test)
    print("准确率为:\n", score)
    return None
knn_iris()
y_predict:
[0 2 0 0 2 1 1 0 2 1 2 1 2 2 1 1 2 1 1 0 0 2 0 0 1 1 1 2 0 1 0 1 0 0 1 2 1
2]
直接对比真实值和预测值:
[ True True True True True True False True True True True True
True True True False True True True True True True True True
True True True True True True True True True True False True
True True]
准确率为:
0.9210526315789473
优点:
简单,易于理解,易于实现,无需训练
缺点:
懒惰算法,对测试样本分类时的计算量大,内存开销大
必须指定K值,K值选择不当则分类精度不能保证
使用场景:小数据场景,几千~几万样本,具体场景具体业务去测试
9.2 模型选择与调优
学习目标
目标
说明交叉验证过程
说明超参数搜索过程
应 GridSearchCV用实现算法参数的调优
应用
鸢尾花数据集预测
Facebook签到位置预测调优
from sklearn.datasets import load_iris
from sklearn.model_selection import train_test_split
from sklearn.preprocessing import StandardScaler
from sklearn.neighbors import KNeighborsClassifier
from sklearn.model_selection import GridSearchCV
def knn_iris():
    """用knn算法对鸢尾花进行分类"""
    # 1)获取数据
    iris = load_iris()
    # 2)划分数据集
    x_train, x_test, y_train, y_test = train_test_split(iris.data, iris.target, random_state=6)
    # 3)特征工程:标准化
    transfer = StandardScaler()
    x_train = transfer.fit_transform(x_train)
    # 对训练集标准化
    x_test = transfer.transform(x_test)
    # 4)KNN算法预估器
    estimator = KNeighborsClassifier(n_neighbors=3)

    # 加入网格搜索与交叉验证
    # 参数准备
    param_dict = {"n_neighbors":[1,3,5,7,9,11]}
    estimator = GridSearchCV(estimator, param_grid=param_dict, cv=10)
    estimator.fit(x_train, y_train)
    # 5)模型评估
    # 方法1:直接比对真实值和预测值
    y_predict = estimator.predict(x_test)
    print("y_predict:\n", y_predict)
    print("直接对比真实值和预测值:\n", y_test==y_predict)
    # 方法2:计算准确率
    score = estimator.score(x_test, y_test)
    print("准确率为:\n", score)

    print("最佳参数:\n", estimator.best_params_)
    print("最佳结果:\n", estimator.best_score_)
    print("最佳估计器:\n", estimator.best_estimator_)
    print("交叉验证结果:\n", estimator.cv_results_)

    return None

knn_iris()
加入了两行代码
    param_dict = {"n_neighbors":[1,3,5,7,9,11]}
    estimator = GridSearchCV(estimator, param_grid=param_dict, cv=10)
y_predict:
[0 2 0 0 2 1 2 0 2 1 2 1 2 2 1 1 2 1 1 0 0 2 0 0 1 1 1 2 0 1 0 1 0 0 1 2 1
2]
直接对比真实值和预测值:
[ True True True True True True True True True True True True
True True True False True True True True True True True True
True True True True True True True True True True False True
True True]
准确率为:
0.9473684210526315
最佳参数:
{'n_neighbors': 11}
最佳结果:
0.9734848484848484
最佳估计器:
KNeighborsClassifier(n_neighbors=11)
交叉验证结果:
{'mean_fit_time': array([0.00071764, 0.00076523, 0.00088694, 0.00059497, 0.00086043,
0.00060651]), 'std_fit_time': array([1.11403693e-04, 4.59219436e-05, 2.44296652e-04, 9.52112737e-05,
3.69338244e-04, 7.96511086e-05]), 'mean_score_time': array([0.00152702, 0.00162141, 0.0019244 , 0.00128505, 0.00159724,
0.001337 ]), 'std_score_time': array([0.00026904, 0.00014548, 0.00059808, 0.00018343, 0.00031739,
0.00016428]), 'param_n_neighbors': masked_array(data=[1, 3, 5, 7, 9, 11],
mask=[False, False, False, False, False, False],
fill_value='?',
dtype=object), 'params': [{'n_neighbors': 1}, {'n_neighbors': 3}, {'n_neighbors': 5}, {'n_neighbors': 7}, {'n_neighbors': 9}, {'n_neighbors': 11}], 'split0_test_score': array([1., 1., 1., 1., 1., 1.]), 'split1_test_score': array([0.91666667, 0.91666667, 1. , 0.91666667, 0.91666667,
0.91666667]), 'split2_test_score': array([1., 1., 1., 1., 1., 1.]), 'split3_test_score': array([1. , 1. , 1. , 1. , 0.90909091,
1. ]), 'split4_test_score': array([1., 1., 1., 1., 1., 1.]), 'split5_test_score': array([0.90909091, 0.90909091, 1. , 1. , 1. ,
1. ]), 'split6_test_score': array([1., 1., 1., 1., 1., 1.]), 'split7_test_score': array([0.90909091, 0.90909091, 0.90909091, 0.90909091, 1. ,
1. ]), 'split8_test_score': array([1., 1., 1., 1., 1., 1.]), 'split9_test_score': array([0.90909091, 0.81818182, 0.81818182, 0.81818182, 0.81818182,
0.81818182]), 'mean_test_score': array([0.96439394, 0.95530303, 0.97272727, 0.96439394, 0.96439394,
0.97348485]), 'std_test_score': array([0.04365767, 0.0604591 , 0.05821022, 0.05965639, 0.05965639,
0.05742104]), 'rank_test_score': array([5, 6, 2, 3, 3, 1], dtype=int32)}
案例:泰坦尼克号乘客生存预测流程分析:
特征值目标值1)获取数据2)数据处理
缺失值处理
特征值->字典类型3)准备好特征值目标值4)划分数据集
5)特征工程:字典特征抽取6)决策树预估器流程
7)模型评估
import pandas as pd
titianic = pd.read_csv('titanic.csv')
titianic.head()
row.names pclass survived name age embarked home.dest room ticket boat sex
0 1 1st 1 Allen, Miss Elisabeth Walton 29.0000 Southampton St Louis, MO B-5 24160 L221 2 female
1 2 1st 0 Allison, Miss Helen Loraine 2.0000 Southampton Montreal, PQ / Chesterville, ON C26 NaN NaN female
2 3 1st 0 Allison, Mr Hudson Joshua Creighton 30.0000 Southampton Montreal, PQ / Chesterville, ON C26 NaN (135) male
3 4 1st 0 Allison, Mrs Hudson J.C. (Bessie Waldo Daniels) 25.0000 Southampton Montreal, PQ / Chesterville, ON C26 NaN NaN female
4 5 1st 1 Allison, Master Hudson Trevor 0.9167 Southampton Montreal, PQ / Chesterville, ON C22 NaN 11 male
# 1.筛选特征值和目标值
x = titianic[['pclass', 'age', 'sex']]
y = titianic['survived']
x.head()
pclass age sex
0 1st 29.0000 female
1 1st 2.0000 female
2 1st 30.0000 male
3 1st 25.0000 female
4 1st 0.9167 male
y.head()
0 1
1 0
2 0
3 0
4 1
Name: survived, dtype: int64
#2.数据处理
# 1)缺失值处理
x['age'].fillna(x['age'].mean(), inplace=True)
# 2)转换成字典
x = x.to_dict(orient='records')

from sklearn.model_selection import train_test_split
# 3)数据集划分
x_train, x_test, y_train, y_test = train_test_split(x, y, random_state=22)

# 4)字典特征抽取
from sklearn.feature_extraction import DictVectorizer
transfer = DictVectorizer()
x_train = transfer.fit_transform(x_train)
x_test = transfer.transform(x_test)
# 5)决策树预估器
from sklearn.tree import DecisionTreeClassifier
from sklearn.tree import export_graphviz
estimator = DecisionTreeClassifier(criterion="entropy")
estimator.fit(x_train, y_train)
# 6)模型评估
# 1,方法1:直接对比真实值和预测值
y_predict = estimator.predict(x_test)
print("y_predict:\n", y_predict)
print("直接对比真实值和预测值:\n", y_test == y_predict)
# 方法2:计算准确率
score = estimator.score(x_test, y_test)
print("准确率为\n", score)
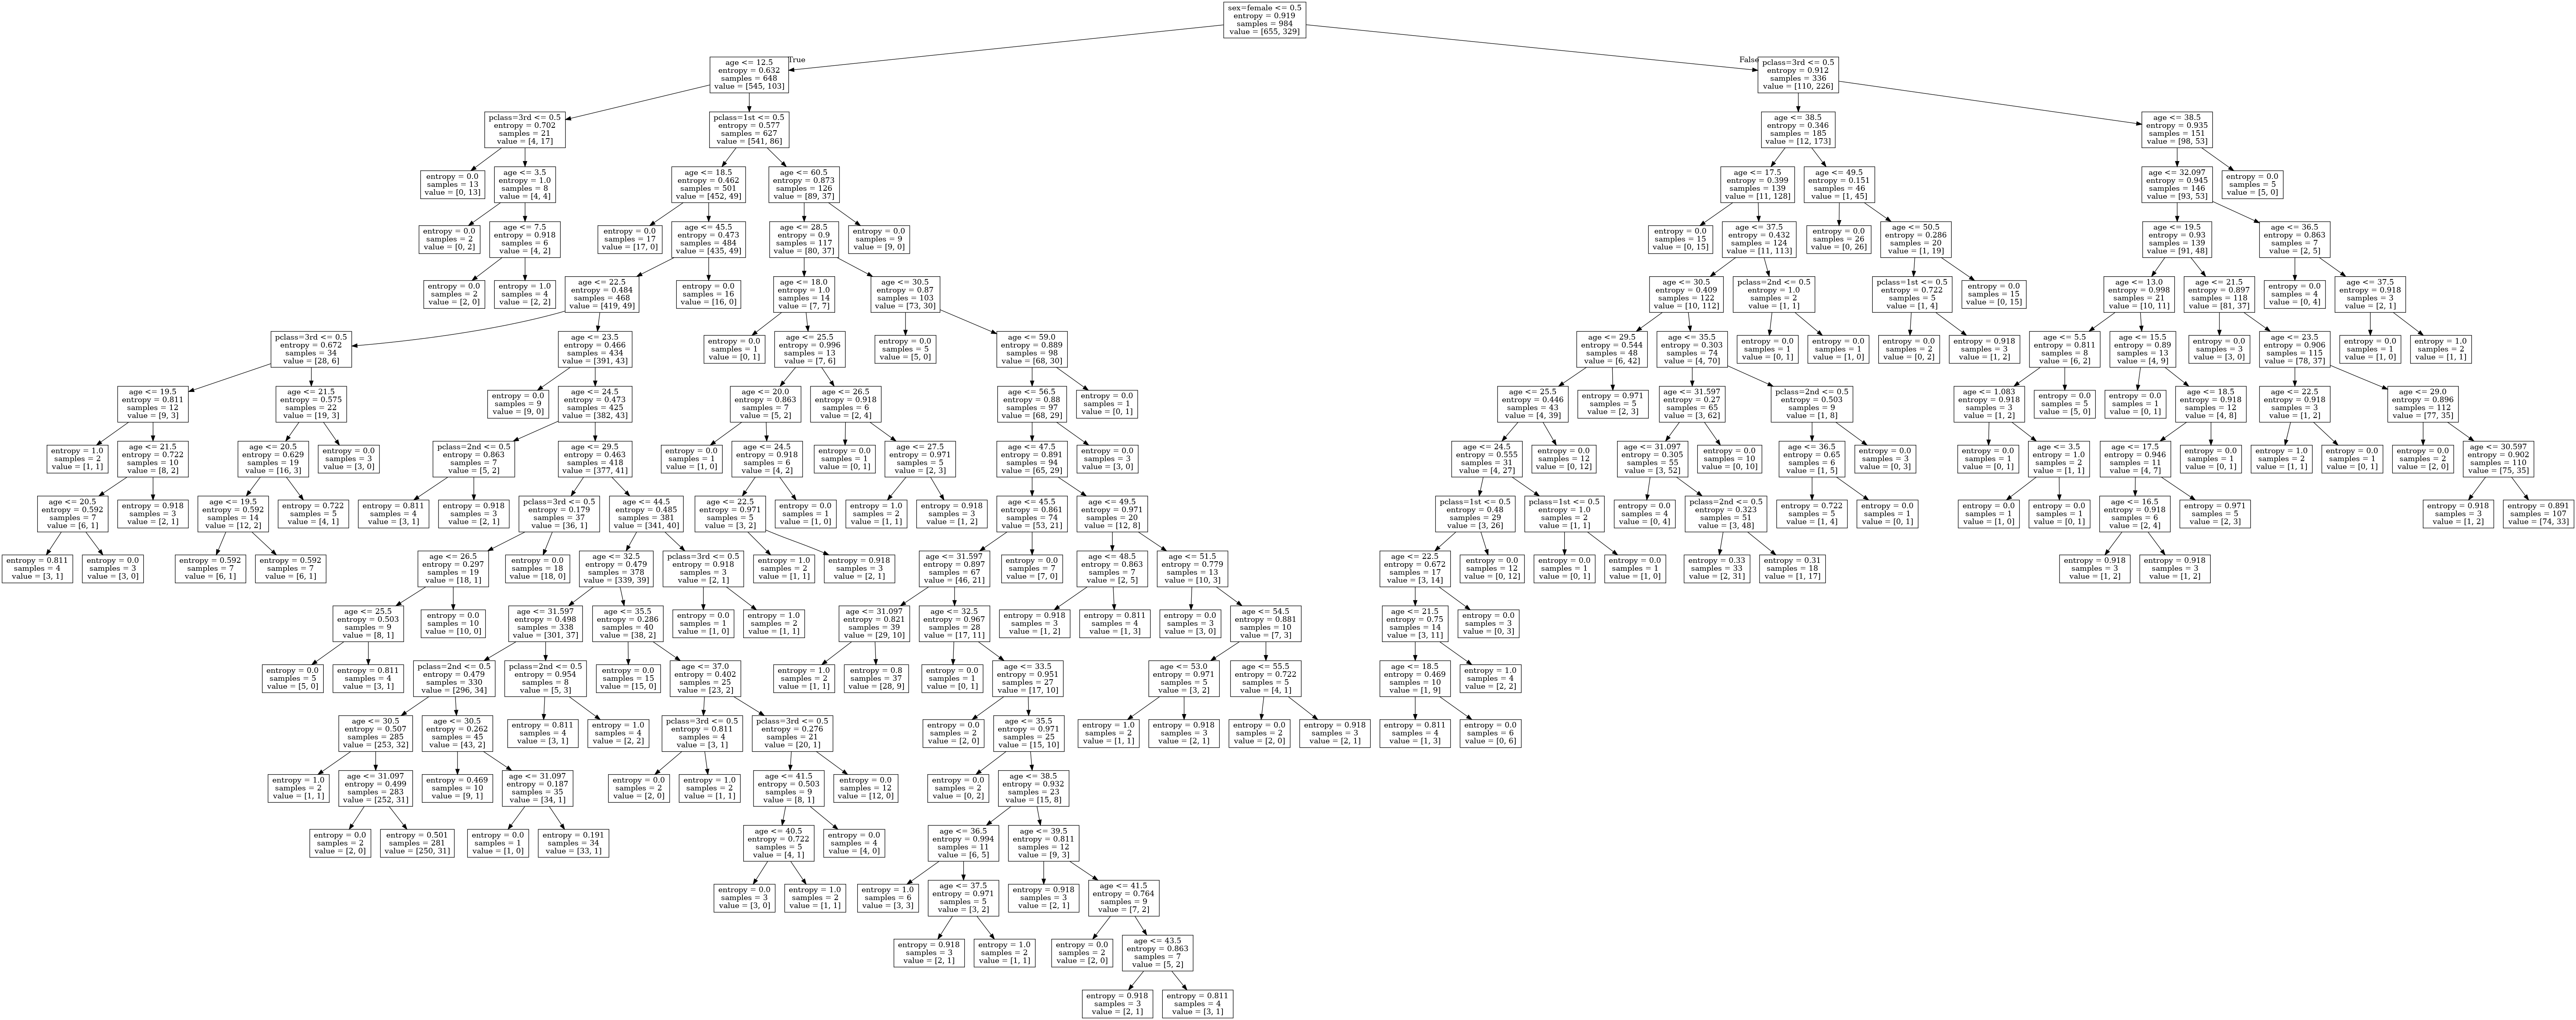
# 可视化决策树
export_graphviz(estimator, out_file="titanic_tree.dot", feature_names=transfer.get_feature_names())
y_predict:
[0 1 0 0 1 1 1 0 0 1 0 1 0 0 0 0 0 0 0 0 0 0 0 0 1 0 0 0 1 1 0 1 0 1 0 0 0
0 0 0 0 0 0 0 0 0 1 1 0 1 0 0 0 0 0 0 0 1 0 0 0 0 0 0 0 0 0 1 0 0 1 0 0 0
1 1 0 0 0 1 0 1 0 0 0 0 0 0 0 0 0 0 0 1 0 1 0 1 0 1 0 0 0 0 0 0 0 0 0 0 1
0 1 0 0 0 0 0 0 0 0 0 1 0 0 1 1 0 1 0 0 0 0 0 0 0 0 0 0 0 1 1 0 0 0 0 1 1
1 0 0 0 0 0 0 0 0 0 0 0 0 0 1 1 0 1 0 0 0 0 1 0 0 0 0 0 1 1 1 1 0 0 0 0 0
0 0 0 1 1 1 0 0 0 0 1 1 1 0 0 0 0 0 0 0 0 0 1 0 0 0 0 0 1 1 0 0 0 0 0 1 0
0 0 1 0 0 0 0 0 0 1 0 0 0 0 1 0 1 0 0 1 1 0 0 1 0 0 0 0 1 0 1 0 0 0 0 1 0
0 1 1 1 0 0 1 1 1 0 1 0 0 0 0 0 0 0 1 0 0 0 0 0 0 0 0 0 0 0 1 0 0 0 0 1 1
0 0 0 1 0 0 1 0 0 0 0 0 0 0 0 0 0 1 0 0 0 0 0 0 1 1 0 1 0 0 0 0 1]
直接对比真实值和预测值:
831 True
261 False
1210 True
1155 True
255 True
...
1146 True
1125 False
386 True
1025 False
337 True
Name: survived, Length: 329, dtype: bool
准确率为
0.7811550151975684
dot -Tpng titanic_tree.dot -o titanic_tree.png
可以设置最大深度为8
estimator = DecisionTreeClassifier(criterion="entropy", max_depth=8)
ubuntu 下使用Graphviz 绘图
要使用Graphviz , 首先要在系统上安装Graphviz, 在ubuntu 中,可以使用以下命令:
sudo apt-get install graphviz
1. 首先需要编辑dot 脚本。
在利用决策树算法进行分类预测的时候,也可以生成一个.dot i形式的 决策树结构。
在这里,可以使用属性的纯文本编辑器进行脚本编写。 (必须是纯文本编辑器,如,vim, notepadd++, 像word 这样的富文本编辑器是不行的 ),只需要设置编码为UTF-8. 最后,文件后缀名以 dot进行结尾。 比如 tree.dot.
2. 选用布局生成结果。
使用 如下命令生成结果。
dot -Tpng sanmplt.dot -o sample.png
对于这条命令, dot, 表示dot 布局, -Tpng, 表示生成png图片格式。 sample.dot 是脚本文件名。 -o sample.png, 表示生成输出的图片名称。
该命令也可以写成:
dot -Kdot -Tpng sample.dot -o sample.png
其中, -Kdot, 表示使用dot 布局。
Graphviz ,支持几种布局引擎:
- dot : 默认布局方式,主要用于有向图
- neato : 主要用于无向图
- twopi : 主要用于径向布局
- circo : 圆环布局
- fdp : 主要用于无向图
- sfdp : 主要绘制较大的无向图
- patchwork : 主要用于树哈希图(tree map)
Graphviz 支持的输出图片格式更是相当的多, 常用的有以下几种:
- pdf :
- gif
- png :
- jpeg : 一种有损压缩图片格式
- bmp : 一种位图格式
- svg : 矢量图,一般用与Web,,可以用浏览器打开
- ps : 矢量线图,多用于打印
3. 查看生成结果。
输出的图片,可以用支持相应图片格式的软件打开。 Graphviz ,软件安装好之后, 有一个图片浏览器,可以进行图片预览。只需要输入命令:
display sample.png
9.4 随机森林
学习算法根据下列算法而建造每棵树:
用N来表示训练用例(样本)的个数,M表示特征数目。
1一次随机选出一个样本,重复N次,(有可能出现重复的样本)。2随机去选出m个特征, m <<M,建立决策树
采取bootstrap抽样
接着9.3的代码
from sklearn.ensemble import RandomForestClassifier
from sklearn.model_selection import GridSearchCV


estimator = RandomForestClassifier()
#加入网格搜索和交叉验证
param_dict = {"n_estimators":[100,200,300,500,800,1200],"max_depth":[5,8,15,25,30]}
estimator = GridSearchCV(estimator,param_grid=param_dict,cv=3)
estimator.fit(x_train,y_train)
# 5) 模型评估
#方法1:直接比对真实值和预测值
y_predict = estimator.predict(x_test)
print("y_predict\n",y_predict)
print("直接比对真实值和预测值\n",y_test==y_predict)
#方法2:计算准确率
score = estimator.score(x_test,y_test)
print("准确率为:",score)
print("最佳参数:\n",estimator.best_params_)
print("最佳结果:\n",estimator.best_score_)
print("最佳估计器:\n",estimator.best_estimator_)
print("交叉验证结果:\n",estimator.cv_results_)
y_predict
[0 0 0 0 1 1 1 0 0 1 0 0 0 0 0 0 0 0 0 0 0 0 0 0 1 0 0 0 1 1 0 1 0 1 0 0 0
0 0 0 0 0 0 0 0 0 1 1 0 1 0 0 0 0 0 0 0 0 0 0 0 0 0 0 0 0 0 1 0 0 1 0 0 0
0 1 0 0 0 1 0 1 0 0 0 0 0 0 0 0 0 0 0 1 0 1 0 1 0 1 0 0 0 0 0 0 0 0 0 0 1
0 1 0 0 0 0 0 0 0 0 0 1 0 0 1 1 0 1 0 0 0 0 0 0 0 0 0 0 0 1 1 0 0 0 0 1 1
1 0 0 0 0 0 0 0 0 0 0 0 0 0 1 1 0 1 0 0 0 0 1 0 0 0 0 0 1 1 1 1 0 0 0 0 0
0 0 0 1 1 1 0 0 0 0 1 1 1 0 0 0 0 0 0 0 0 0 1 0 0 0 0 0 1 1 0 0 0 0 0 1 0
0 0 1 0 0 0 0 0 0 1 0 0 0 0 1 0 1 0 0 0 1 0 0 1 0 0 0 0 1 0 1 0 0 0 0 1 0
0 1 1 1 0 0 1 1 1 0 1 0 0 0 0 0 0 0 1 0 0 0 0 0 0 0 0 0 0 0 1 0 0 0 0 1 1
0 0 0 1 0 0 0 0 0 0 0 0 0 0 0 0 0 1 0 0 0 0 0 0 1 1 0 1 0 0 0 0 1]
直接比对真实值和预测值
831 True
261 True
1210 True
1155 True
255 True
...
1146 True
1125 False
386 True
1025 False
337 True
Name: survived, Length: 329, dtype: bool
准确率为: 0.7872340425531915
最佳参数:
{'max_depth': 5, 'n_estimators': 300}
最佳结果:
0.8353658536585366
最佳估计器:
RandomForestClassifier(max_depth=5, n_estimators=300)
交叉验证结果:
{'mean_fit_time': array([0.16532405, 0.32869959, 0.50646567, 0.95186106, 1.3400046 ,
2.20329444, 0.18314004, 0.42798392, 0.60835632, 1.01681447,
1.49545328, 2.21191788, 0.19376556, 0.36868191, 0.59179735,
0.94092449, 1.49602071, 2.25964864, 0.17555435, 0.32695691,
0.56035137, 0.97982311, 1.5205915 , 2.21045192, 0.2272381 ,
0.40590906, 0.61741392, 0.99358431, 1.58298278, 2.28477852]), 'std_fit_time': array([0.00587525, 0.00570272, 0.01194974, 0.04289961, 0.05151858,
0.0357362 , 0.02731698, 0.04637141, 0.00683297, 0.04086632,
0.0474102 , 0.0738358 , 0.02373529, 0.02812906, 0.03633019,
0.02531645, 0.02897625, 0.08327705, 0.01079148, 0.01787366,
0.00613515, 0.05754331, 0.04361372, 0.09573313, 0.00212111,
0.02946661, 0.01353294, 0.02763636, 0.0166025 , 0.07269804]), 'mean_score_time': array([0.01202941, 0.02550141, 0.03749394, 0.06609623, 0.09115998,
0.15070724, 0.01562921, 0.02314846, 0.04496884, 0.06610831,
0.10253501, 0.15883676, 0.01315276, 0.03523668, 0.0420142 ,
0.06942916, 0.10876489, 0.14853573, 0.01273147, 0.02245943,
0.0400366 , 0.07173133, 0.10425162, 0.17172503, 0.01642044,
0.02664336, 0.04560741, 0.07092754, 0.10321283, 0.16453846]), 'std_score_time': array([0.0008196 , 0.00347313, 0.00521209, 0.00671466, 0.00909065,
0.01793069, 0.00263547, 0.00048743, 0.00205163, 0.00451061,
0.0054068 , 0.00614102, 0.0016299 , 0.00366082, 0.00602636,
0.00870838, 0.0133909 , 0.00935846, 0.00105836, 0.00058921,
0.00470123, 0.00812656, 0.00690063, 0.00239169, 0.00129976,
0.00279923, 0.00595252, 0.00349063, 0.00759955, 0.00986226]), 'param_max_depth': masked_array(data=[5, 5, 5, 5, 5, 5, 8, 8, 8, 8, 8, 8, 15, 15, 15, 15, 15,
15, 25, 25, 25, 25, 25, 25, 30, 30, 30, 30, 30, 30],
mask=[False, False, False, False, False, False, False, False,
False, False, False, False, False, False, False, False,
False, False, False, False, False, False, False, False,
False, False, False, False, False, False],
fill_value='?',
dtype=object), 'param_n_estimators': masked_array(data=[100, 200, 300, 500, 800, 1200, 100, 200, 300, 500, 800,
1200, 100, 200, 300, 500, 800, 1200, 100, 200, 300,
500, 800, 1200, 100, 200, 300, 500, 800, 1200],
mask=[False, False, False, False, False, False, False, False,
False, False, False, False, False, False, False, False,
False, False, False, False, False, False, False, False,
False, False, False, False, False, False],
fill_value='?',
dtype=object), 'params': [{'max_depth': 5, 'n_estimators': 100}, {'max_depth': 5, 'n_estimators': 200}, {'max_depth': 5, 'n_estimators': 300}, {'max_depth': 5, 'n_estimators': 500}, {'max_depth': 5, 'n_estimators': 800}, {'max_depth': 5, 'n_estimators': 1200}, {'max_depth': 8, 'n_estimators': 100}, {'max_depth': 8, 'n_estimators': 200}, {'max_depth': 8, 'n_estimators': 300}, {'max_depth': 8, 'n_estimators': 500}, {'max_depth': 8, 'n_estimators': 800}, {'max_depth': 8, 'n_estimators': 1200}, {'max_depth': 15, 'n_estimators': 100}, {'max_depth': 15, 'n_estimators': 200}, {'max_depth': 15, 'n_estimators': 300}, {'max_depth': 15, 'n_estimators': 500}, {'max_depth': 15, 'n_estimators': 800}, {'max_depth': 15, 'n_estimators': 1200}, {'max_depth': 25, 'n_estimators': 100}, {'max_depth': 25, 'n_estimators': 200}, {'max_depth': 25, 'n_estimators': 300}, {'max_depth': 25, 'n_estimators': 500}, {'max_depth': 25, 'n_estimators': 800}, {'max_depth': 25, 'n_estimators': 1200}, {'max_depth': 30, 'n_estimators': 100}, {'max_depth': 30, 'n_estimators': 200}, {'max_depth': 30, 'n_estimators': 300}, {'max_depth': 30, 'n_estimators': 500}, {'max_depth': 30, 'n_estimators': 800}, {'max_depth': 30, 'n_estimators': 1200}], 'split0_test_score': array([0.82621951, 0.82621951, 0.82926829, 0.82621951, 0.83231707,
0.82926829, 0.82012195, 0.81707317, 0.80792683, 0.80487805,
0.81707317, 0.81402439, 0.79268293, 0.79268293, 0.80487805,
0.79573171, 0.79878049, 0.79573171, 0.79878049, 0.79268293,
0.79573171, 0.79268293, 0.79268293, 0.80182927, 0.79878049,
0.79268293, 0.79268293, 0.79878049, 0.79268293, 0.79573171]), 'split1_test_score': array([0.85365854, 0.85060976, 0.85060976, 0.85365854, 0.85060976,
0.85060976, 0.85060976, 0.85365854, 0.84756098, 0.85365854,
0.85365854, 0.85365854, 0.8445122 , 0.84146341, 0.8445122 ,
0.85670732, 0.85365854, 0.85060976, 0.8445122 , 0.85060976,
0.85060976, 0.85060976, 0.85670732, 0.85670732, 0.84756098,
0.8445122 , 0.85365854, 0.85060976, 0.85365854, 0.85365854]), 'split2_test_score': array([0.82317073, 0.82621951, 0.82621951, 0.82317073, 0.82317073,
0.82621951, 0.79573171, 0.80182927, 0.80182927, 0.80182927,
0.80182927, 0.80182927, 0.80182927, 0.80182927, 0.80487805,
0.80182927, 0.80182927, 0.80182927, 0.80792683, 0.79573171,
0.80487805, 0.80487805, 0.80182927, 0.80487805, 0.80487805,
0.79878049, 0.80182927, 0.80182927, 0.80182927, 0.80182927]), 'mean_test_score': array([0.83434959, 0.83434959, 0.83536585, 0.83434959, 0.83536585,
0.83536585, 0.82215447, 0.82418699, 0.81910569, 0.82012195,
0.82418699, 0.82317073, 0.81300813, 0.81199187, 0.81808943,
0.81808943, 0.81808943, 0.81605691, 0.81707317, 0.81300813,
0.81707317, 0.81605691, 0.81707317, 0.82113821, 0.81707317,
0.81199187, 0.81605691, 0.81707317, 0.81605691, 0.81707317]), 'std_test_score': array([0.0137101 , 0.01149767, 0.01085069, 0.0137101 , 0.01140749,
0.01085069, 0.02244992, 0.02174892, 0.02027433, 0.02374659,
0.02174892, 0.02212555, 0.02258751, 0.02117141, 0.01868372,
0.0274202 , 0.02518193, 0.02455904, 0.01975836, 0.02661748,
0.02400612, 0.02493464, 0.02827323, 0.02518193, 0.02170138,
0.02312969, 0.02684928, 0.02374659, 0.02684928, 0.02598925]), 'rank_test_score': array([ 4, 4, 1, 4, 1, 1, 10, 7, 13, 12, 7, 9, 27, 29, 14, 14, 14,
23, 17, 27, 17, 23, 17, 11, 17, 29, 23, 17, 23, 17], dtype=int32)}
总结
在当前所有算法中,具有极好的准确率
能够有效地运行在大数据集上,处理具有高维特症的输入样本,而且不需要降维。能够评估各个特征在分类问题上的重要性
from sklearn.datasets import load_boston
from sklearn.model_selection import train_test_split
from sklearn.preprocessing import StandardScaler
from sklearn.linear_model import LinearRegression, SGDRegressor
from sklearn.metrics import mean_squared_error
def linear1():
    """
    正规方程的优化方法对波士顿房价进行预测
    :return
    """
    # 1)获取数据
    boston = load_boston()
    # 2)划分数据集
    x_train, x_test, y_train, y_test = train_test_split(boston.data, boston.target,random_state=22)
    # 3)标准化
    transfer = StandardScaler()
    x_train = transfer.fit_transform(x_train)
    x_test = transfer.transform(x_test)
    # 4)预估器
    estimator = LinearRegression()
    estimator.fit(x_train, y_train)
    # 5)得出模型
    print("权重系数为:\n", estimator.coef_)
    print("偏执为\n", estimator.intercept_)
    # 6)模型评估
    y_predict = estimator.predict(x_test)
    print("预测房价:\n", y_predict)
    error = mean_squared_error(y_test, y_predict)
    print("正规方程-均方误差\n", error)

def linear2():
    """
    梯度下降的优化方法对波士顿房价进行预测
    :return
    """
    # 1)获取数据
    boston = load_boston()

    print("特征数量为:\n", boston.data.shape)
    # 2)划分数据集
    x_train, x_test, y_train, y_test = train_test_split(boston.data, boston.target,random_state=22)
    # 3)标准化
    transfer = StandardScaler()
    x_train = transfer.fit_transform(x_train)
    x_test = transfer.transform(x_test)
    # 4)预估器
    estimator = SGDRegressor()
    estimator.fit(x_train, y_train)
    # 5)得出模型
    print("权重系数为:\n", estimator.coef_)
    print("偏执为\n", estimator.intercept_)
    # 6)模型评估
    y_predict = estimator.predict(x_test)
    print("预测房价:\n", y_predict)
    error = mean_squared_error(y_test, y_predict)
    print("梯度下降-均方误差\n", error)
if __name__ == '__main__':
    # 代码1:正规方程的优化方法对波士顿房价进行预测
    linear1()
    # 代码2:梯度下降的优化方法对波士顿房价进行预测
    linear2()
权重系数为:
[-0.64817766 1.14673408 -0.05949444 0.74216553 -1.95515269 2.70902585
-0.07737374 -3.29889391 2.50267196 -1.85679269 -1.75044624 0.87341624
-3.91336869]
偏执为
22.62137203166228
预测房价:
[28.22944896 31.5122308 21.11612841 32.6663189 20.0023467 19.07315705
21.09772798 19.61400153 19.61907059 32.87611987 20.97911561 27.52898011
15.54701758 19.78630176 36.88641203 18.81202132 9.35912225 18.49452615
30.66499315 24.30184448 19.08220837 34.11391208 29.81386585 17.51775647
34.91026707 26.54967053 34.71035391 27.4268996 19.09095832 14.92742976
30.86877936 15.88271775 37.17548808 7.72101675 16.24074861 17.19211608
7.42140081 20.0098852 40.58481466 28.93190595 25.25404307 17.74970308
38.76446932 6.87996052 21.80450956 25.29110265 20.427491 20.4698034
17.25330064 26.12442519 8.48268143 27.50871869 30.58284841 16.56039764
9.38919181 35.54434377 32.29801978 21.81298945 17.60263689 22.0804256
23.49262401 24.10617033 20.1346492 38.5268066 24.58319594 19.78072415
13.93429891 6.75507808 42.03759064 21.9215625 16.91352899 22.58327744
40.76440704 21.3998946 36.89912238 27.19273661 20.97945544 20.37925063
25.3536439 22.18729123 31.13342301 20.39451125 23.99224334 31.54729547
26.74581308 20.90199941 29.08225233 21.98331503 26.29101202 20.17329401
25.49225305 24.09171045 19.90739221 16.35154974 15.25184758 18.40766132
24.83797801 16.61703662 20.89470344 26.70854061 20.7591883 17.88403312
24.28656105 23.37651493 21.64202047 36.81476219 15.86570054 21.42338732
32.81366203 33.74086414 20.61688336 26.88191023 22.65739323 17.35731771
21.67699248 21.65034728 27.66728556 25.04691687 23.73976625 14.6649641
15.17700342 3.81620663 29.18194848 20.68544417 22.32934783 28.01568563
28.58237108]
正规方程-均方误差
20.627513763095408
特征数量为:
(506, 13)
权重系数为:
[-0.55078335 0.99518965 -0.34536904 0.77995714 -1.78079408 2.75119045
-0.12145352 -3.20135649 1.84747247 -1.10020821 -1.71610982 0.85725853
-3.86717657]
偏执为
[22.63300361]
预测房价:
[28.21653785 31.52873166 21.41535043 32.62403388 20.14768359 19.15790283
21.35456806 19.43053962 19.63043863 32.76476034 21.3412275 27.37169487
15.68409197 19.95252988 36.84773086 18.77879955 9.69013991 18.60455284
30.61079275 24.23488526 19.14770896 34.00387003 29.53191421 17.57303677
34.70223645 26.52253181 34.33815042 27.29229479 19.22889861 15.51559777
30.78132625 14.86310246 37.30877985 8.69460845 16.38983931 17.07956235
7.88963072 19.93713575 40.34618609 28.96873604 25.19684887 17.89591607
39.04845654 7.0059872 21.70980061 25.08633192 20.80574459 20.63462764
17.16751874 26.30367245 9.60130018 27.18275243 30.56336533 16.80932801
9.71302944 35.40214782 31.66124848 22.64842246 17.61903092 21.82607502
23.60503482 23.98157616 20.27718546 38.09336634 25.4118349 19.80756346
14.21242444 6.97989796 42.18369091 21.83428767 16.9448828 22.46677436
40.69591067 21.62894022 36.78300525 27.13516915 21.55066299 20.71507888
25.23279958 23.33158025 31.31913258 20.23225637 23.97507973 31.40991294
27.11457036 20.95454164 29.05792494 21.87247423 26.60122191 19.12328303
25.30840657 24.04446385 19.9966597 17.49207675 15.53883933 18.41759985
24.61681276 16.82170296 20.82415916 26.70388651 20.82394512 18.0509366
24.19607837 23.29229988 20.60563212 36.53886694 15.99998171 22.22608903
32.60526215 33.7410985 20.5817842 26.19033617 23.12321985 17.70608494
21.47980121 21.71428528 27.45624347 25.13687056 23.67604969 14.67936973
15.67389655 4.01192555 29.18046416 20.7332199 22.29760947 27.96479512
28.4238565 ]
梯度下降-均方误差
21.15687889026568
|
梯度下降 |
正规方程 |
|
需要选择学习率 |
不需要需 |
|
要迭代求解 |
一次运算得出 |
|
特征数量较大可以使用 |
需要计算方程,时间复杂度高O(n3) |
Ridge方法相当于SGDRegressor(penalty='I2', loss="squared_loss"),只不过SGDRegressor实现了一个普通的随机梯度下降学习,推荐使用Ridge(实现了SAG)
def linear3():
    """
    梯度下降的优化方法对波士顿房价进行预测
    :return
    """
    # 1)获取数据
    boston = load_boston()

    print("特征数量为:\n", boston.data.shape)
    # 2)划分数据集
    x_train, x_test, y_train, y_test = train_test_split(boston.data, boston.target,random_state=22)
    # 3)标准化
    transfer = StandardScaler()
    x_train = transfer.fit_transform(x_train)
    x_test = transfer.transform(x_test)
    # 4)预估器
    estimator = Ridge()
    estimator.fit(x_train, y_train)
    # 5)得出模型
    print("岭回归-权重系数为:\n", estimator.coef_)
    print("岭回归-偏执为\n", estimator.intercept_)
    # 6)模型评估
    y_predict = estimator.predict(x_test)
    print("预测房价:\n", y_predict)
    error = mean_squared_error(y_test, y_predict)
    print("岭回归-均方误差\n", error)
岭回归-权重系数为:
[-0.63591916 1.12109181 -0.09319611 0.74628129 -1.91888749 2.71927719
-0.08590464 -3.25882705 2.41315949 -1.76930347 -1.74279405 0.87205004
-3.89758657]
岭回归-偏执为
22.62137203166228
预测房价:
[28.22119941 31.49858594 21.14690941 32.64962343 20.03976087 19.07187629
21.11827061 19.61935024 19.64669848 32.83666525 21.01034708 27.47939935
15.55875601 19.80406014 36.86415472 18.79442579 9.42343608 18.5205955
30.67129766 24.30659711 19.07820077 34.08772738 29.77396117 17.50394928
34.87750492 26.52508961 34.65566473 27.42939944 19.08639183 15.04854291
30.84974343 15.76894723 37.18814441 7.81864035 16.27847433 17.15510852
7.46590141 19.98474662 40.55565604 28.96103939 25.25570196 17.7598197
38.78171653 6.87935126 21.76805062 25.25888823 20.47319256 20.48808719
17.24949519 26.11755181 8.61005188 27.47070495 30.57806886 16.57080888
9.42312214 35.50731907 32.20467352 21.93128073 17.62011278 22.08454636
23.50121152 24.08248876 20.16840581 38.47001591 24.69276673 19.7638548
13.96547058 6.76070715 42.04033544 21.9237625 16.88030656 22.60637682
40.74664535 21.44631815 36.86936185 27.17135794 21.09470367 20.40689317
25.35934079 22.35676321 31.1513028 20.39303322 23.99948991 31.54251155
26.77734347 20.89368871 29.05880401 22.00850263 26.31965286 20.04852734
25.46476799 24.08084537 19.90846889 16.47030743 15.27936372 18.39475348
24.80822272 16.62280764 20.86393724 26.70418608 20.74534996 17.89544942
24.25949423 23.35743497 21.51817773 36.76202304 15.90293344 21.52915882
32.78684766 33.68666117 20.61700911 26.78345059 22.72685584 17.40478038
21.67136433 21.6912557 27.66684993 25.08825085 23.72539867 14.64260535
15.21105331 3.81916568 29.16662813 20.67913144 22.33386579 28.01241753
28.531445 ]
岭回归-均方误差
20.656448214354967
from sklearn.datasets import load_breast_cancer
from sklearn.ensemble import RandomForestClassifier
from sklearn.model_selection import GridSearchCV
from sklearn.model_selection import cross_val_score
import matplotlib.pyplot as plt
import pandas as pd
import numpy as np
data = load_breast_cancer()
data
{'data': array([[1.799e+01, 1.038e+01, 1.228e+02, ..., 2.654e-01, 4.601e-01,
1.189e-01],
[2.057e+01, 1.777e+01, 1.329e+02, ..., 1.860e-01, 2.750e-01,
8.902e-02],
[1.969e+01, 2.125e+01, 1.300e+02, ..., 2.430e-01, 3.613e-01,
8.758e-02],
...,
[1.660e+01, 2.808e+01, 1.083e+02, ..., 1.418e-01, 2.218e-01,
7.820e-02],
[2.060e+01, 2.933e+01, 1.401e+02, ..., 2.650e-01, 4.087e-01,
1.240e-01],
[7.760e+00, 2.454e+01, 4.792e+01, ..., 0.000e+00, 2.871e-01,
7.039e-02]]),
'target': array([0, 0, 0, 0, 0, 0, 0, 0, 0, 0, 0, 0, 0, 0, 0, 0, 0, 0, 0, 1, 1, 1,
0, 0, 0, 0, 0, 0, 0, 0, 0, 0, 0, 0, 0, 0, 0, 1, 0, 0, 0, 0, 0, 0,
0, 0, 1, 0, 1, 1, 1, 1, 1, 0, 0, 1, 0, 0, 1, 1, 1, 1, 0, 1, 0, 0,
1, 1, 1, 1, 0, 1, 0, 0, 1, 0, 1, 0, 0, 1, 1, 1, 0, 0, 1, 0, 0, 0,
1, 1, 1, 0, 1, 1, 0, 0, 1, 1, 1, 0, 0, 1, 1, 1, 1, 0, 1, 1, 0, 1,
1, 1, 1, 1, 1, 1, 1, 0, 0, 0, 1, 0, 0, 1, 1, 1, 0, 0, 1, 0, 1, 0,
0, 1, 0, 0, 1, 1, 0, 1, 1, 0, 1, 1, 1, 1, 0, 1, 1, 1, 1, 1, 1, 1,
1, 1, 0, 1, 1, 1, 1, 0, 0, 1, 0, 1, 1, 0, 0, 1, 1, 0, 0, 1, 1, 1,
1, 0, 1, 1, 0, 0, 0, 1, 0, 1, 0, 1, 1, 1, 0, 1, 1, 0, 0, 1, 0, 0,
0, 0, 1, 0, 0, 0, 1, 0, 1, 0, 1, 1, 0, 1, 0, 0, 0, 0, 1, 1, 0, 0,
1, 1, 1, 0, 1, 1, 1, 1, 1, 0, 0, 1, 1, 0, 1, 1, 0, 0, 1, 0, 1, 1,
1, 1, 0, 1, 1, 1, 1, 1, 0, 1, 0, 0, 0, 0, 0, 0, 0, 0, 0, 0, 0, 0,
0, 0, 1, 1, 1, 1, 1, 1, 0, 1, 0, 1, 1, 0, 1, 1, 0, 1, 0, 0, 1, 1,
1, 1, 1, 1, 1, 1, 1, 1, 1, 1, 1, 0, 1, 1, 0, 1, 0, 1, 1, 1, 1, 1,
1, 1, 1, 1, 1, 1, 1, 1, 1, 0, 1, 1, 1, 0, 1, 0, 1, 1, 1, 1, 0, 0,
0, 1, 1, 1, 1, 0, 1, 0, 1, 0, 1, 1, 1, 0, 1, 1, 1, 1, 1, 1, 1, 0,
0, 0, 1, 1, 1, 1, 1, 1, 1, 1, 1, 1, 1, 0, 0, 1, 0, 0, 0, 1, 0, 0,
1, 1, 1, 1, 1, 0, 1, 1, 1, 1, 1, 0, 1, 1, 1, 0, 1, 1, 0, 0, 1, 1,
1, 1, 1, 1, 0, 1, 1, 1, 1, 1, 1, 1, 0, 1, 1, 1, 1, 1, 0, 1, 1, 0,
1, 1, 1, 1, 1, 1, 1, 1, 1, 1, 1, 1, 0, 1, 0, 0, 1, 0, 1, 1, 1, 1,
1, 0, 1, 1, 0, 1, 0, 1, 1, 0, 1, 0, 1, 1, 1, 1, 1, 1, 1, 1, 0, 0,
1, 1, 1, 1, 1, 1, 0, 1, 1, 1, 1, 1, 1, 1, 1, 1, 1, 0, 1, 1, 1, 1,
1, 1, 1, 0, 1, 0, 1, 1, 0, 1, 1, 1, 1, 1, 0, 0, 1, 0, 1, 0, 1, 1,
1, 1, 1, 0, 1, 1, 0, 1, 0, 1, 0, 0, 1, 1, 1, 0, 1, 1, 1, 1, 1, 1,
1, 1, 1, 1, 1, 0, 1, 0, 0, 1, 1, 1, 1, 1, 1, 1, 1, 1, 1, 1, 1, 1,
1, 1, 1, 1, 1, 1, 1, 1, 1, 1, 1, 1, 0, 0, 0, 0, 0, 0, 1]),
'frame': None,
'target_names': array(['malignant', 'benign'], dtype='<U9'),
'DESCR': '.. _breast_cancer_dataset:\n\nBreast cancer wisconsin (diagnostic) dataset\n--------------------------------------------\n\n**Data Set Characteristics:**\n\n :Number of Instances: 569\n\n :Number of Attributes: 30 numeric, predictive attributes and the class\n\n :Attribute Information:\n - radius (mean of distances from center to points on the perimeter)\n - texture (standard deviation of gray-scale values)\n - perimeter\n - area\n - smoothness (local variation in radius lengths)\n - compactness (perimeter^2 / area - 1.0)\n - concavity (severity of concave portions of the contour)\n - concave points (number of concave portions of the contour)\n - symmetry\n - fractal dimension ("coastline approximation" - 1)\n\n The mean, standard error, and "worst" or largest (mean of the three\n worst/largest values) of these features were computed for each image,\n resulting in 30 features. For instance, field 0 is Mean Radius, field\n 10 is Radius SE, field 20 is Worst Radius.\n\n - class:\n - WDBC-Malignant\n - WDBC-Benign\n\n :Summary Statistics:\n\n ===================================== ====== ======\n Min Max\n ===================================== ====== ======\n radius (mean): 6.981 28.11\n texture (mean): 9.71 39.28\n perimeter (mean): 43.79 188.5\n area (mean): 143.5 2501.0\n smoothness (mean): 0.053 0.163\n compactness (mean): 0.019 0.345\n concavity (mean): 0.0 0.427\n concave points (mean): 0.0 0.201\n symmetry (mean): 0.106 0.304\n fractal dimension (mean): 0.05 0.097\n radius (standard error): 0.112 2.873\n texture (standard error): 0.36 4.885\n perimeter (standard error): 0.757 21.98\n area (standard error): 6.802 542.2\n smoothness (standard error): 0.002 0.031\n compactness (standard error): 0.002 0.135\n concavity (standard error): 0.0 0.396\n concave points (standard error): 0.0 0.053\n symmetry (standard error): 0.008 0.079\n fractal dimension (standard error): 0.001 0.03\n radius (worst): 7.93 36.04\n texture (worst): 12.02 49.54\n perimeter (worst): 50.41 251.2\n area (worst): 185.2 4254.0\n smoothness (worst): 0.071 0.223\n compactness (worst): 0.027 1.058\n concavity (worst): 0.0 1.252\n concave points (worst): 0.0 0.291\n symmetry (worst): 0.156 0.664\n fractal dimension (worst): 0.055 0.208\n ===================================== ====== ======\n\n :Missing Attribute Values: None\n\n :Class Distribution: 212 - Malignant, 357 - Benign\n\n :Creator: Dr. William H. Wolberg, W. Nick Street, Olvi L. Mangasarian\n\n :Donor: Nick Street\n\n :Date: November, 1995\n\nThis is a copy of UCI ML Breast Cancer Wisconsin (Diagnostic) datasets.\nhttps://goo.gl/U2Uwz2\n\nFeatures are computed from a digitized image of a fine needle\naspirate (FNA) of a breast mass. They describe\ncharacteristics of the cell nuclei present in the image.\n\nSeparating plane described above was obtained using\nMultisurface Method-Tree (MSM-T) [K. P. Bennett, "Decision Tree\nConstruction Via Linear Programming." Proceedings of the 4th\nMidwest Artificial Intelligence and Cognitive Science Society,\npp. 97-101, 1992], a classification method which uses linear\nprogramming to construct a decision tree. Relevant features\nwere selected using an exhaustive search in the space of 1-4\nfeatures and 1-3 separating planes.\n\nThe actual linear program used to obtain the separating plane\nin the 3-dimensional space is that described in:\n[K. P. Bennett and O. L. Mangasarian: "Robust Linear\nProgramming Discrimination of Two Linearly Inseparable Sets",\nOptimization Methods and Software 1, 1992, 23-34].\n\nThis database is also available through the UW CS ftp server:\n\nftp ftp.cs.wisc.edu\ncd math-prog/cpo-dataset/machine-learn/WDBC/\n\n.. topic:: References\n\n - W.N. Street, W.H. Wolberg and O.L. Mangasarian. Nuclear feature extraction \n for breast tumor diagnosis. IS&T/SPIE 1993 International Symposium on \n Electronic Imaging: Science and Technology, volume 1905, pages 861-870,\n San Jose, CA, 1993.\n - O.L. Mangasarian, W.N. Street and W.H. Wolberg. Breast cancer diagnosis and \n prognosis via linear programming. Operations Research, 43(4), pages 570-577, \n July-August 1995.\n - W.H. Wolberg, W.N. Street, and O.L. Mangasarian. Machine learning techniques\n to diagnose breast cancer from fine-needle aspirates. Cancer Letters 77 (1994) \n 163-171.',
'feature_names': array(['mean radius', 'mean texture', 'mean perimeter', 'mean area',
'mean smoothness', 'mean compactness', 'mean concavity',
'mean concave points', 'mean symmetry', 'mean fractal dimension',
'radius error', 'texture error', 'perimeter error', 'area error',
'smoothness error', 'compactness error', 'concavity error',
'concave points error', 'symmetry error',
'fractal dimension error', 'worst radius', 'worst texture',
'worst perimeter', 'worst area', 'worst smoothness',
'worst compactness', 'worst concavity', 'worst concave points',
'worst symmetry', 'worst fractal dimension'], dtype='<U23'),
'filename': 'breast_cancer.csv',
'data_module': 'sklearn.datasets.data'}
data.data.shape
(569, 30)
data.target
array([0, 0, 0, 0, 0, 0, 0, 0, 0, 0, 0, 0, 0, 0, 0, 0, 0, 0, 0, 1, 1, 1,
0, 0, 0, 0, 0, 0, 0, 0, 0, 0, 0, 0, 0, 0, 0, 1, 0, 0, 0, 0, 0, 0,
0, 0, 1, 0, 1, 1, 1, 1, 1, 0, 0, 1, 0, 0, 1, 1, 1, 1, 0, 1, 0, 0,
1, 1, 1, 1, 0, 1, 0, 0, 1, 0, 1, 0, 0, 1, 1, 1, 0, 0, 1, 0, 0, 0,
1, 1, 1, 0, 1, 1, 0, 0, 1, 1, 1, 0, 0, 1, 1, 1, 1, 0, 1, 1, 0, 1,
1, 1, 1, 1, 1, 1, 1, 0, 0, 0, 1, 0, 0, 1, 1, 1, 0, 0, 1, 0, 1, 0,
0, 1, 0, 0, 1, 1, 0, 1, 1, 0, 1, 1, 1, 1, 0, 1, 1, 1, 1, 1, 1, 1,
1, 1, 0, 1, 1, 1, 1, 0, 0, 1, 0, 1, 1, 0, 0, 1, 1, 0, 0, 1, 1, 1,
1, 0, 1, 1, 0, 0, 0, 1, 0, 1, 0, 1, 1, 1, 0, 1, 1, 0, 0, 1, 0, 0,
0, 0, 1, 0, 0, 0, 1, 0, 1, 0, 1, 1, 0, 1, 0, 0, 0, 0, 1, 1, 0, 0,
1, 1, 1, 0, 1, 1, 1, 1, 1, 0, 0, 1, 1, 0, 1, 1, 0, 0, 1, 0, 1, 1,
1, 1, 0, 1, 1, 1, 1, 1, 0, 1, 0, 0, 0, 0, 0, 0, 0, 0, 0, 0, 0, 0,
0, 0, 1, 1, 1, 1, 1, 1, 0, 1, 0, 1, 1, 0, 1, 1, 0, 1, 0, 0, 1, 1,
1, 1, 1, 1, 1, 1, 1, 1, 1, 1, 1, 0, 1, 1, 0, 1, 0, 1, 1, 1, 1, 1,
1, 1, 1, 1, 1, 1, 1, 1, 1, 0, 1, 1, 1, 0, 1, 0, 1, 1, 1, 1, 0, 0,
0, 1, 1, 1, 1, 0, 1, 0, 1, 0, 1, 1, 1, 0, 1, 1, 1, 1, 1, 1, 1, 0,
0, 0, 1, 1, 1, 1, 1, 1, 1, 1, 1, 1, 1, 0, 0, 1, 0, 0, 0, 1, 0, 0,
1, 1, 1, 1, 1, 0, 1, 1, 1, 1, 1, 0, 1, 1, 1, 0, 1, 1, 0, 0, 1, 1,
1, 1, 1, 1, 0, 1, 1, 1, 1, 1, 1, 1, 0, 1, 1, 1, 1, 1, 0, 1, 1, 0,
1, 1, 1, 1, 1, 1, 1, 1, 1, 1, 1, 1, 0, 1, 0, 0, 1, 0, 1, 1, 1, 1,
1, 0, 1, 1, 0, 1, 0, 1, 1, 0, 1, 0, 1, 1, 1, 1, 1, 1, 1, 1, 0, 0,
1, 1, 1, 1, 1, 1, 0, 1, 1, 1, 1, 1, 1, 1, 1, 1, 1, 0, 1, 1, 1, 1,
1, 1, 1, 0, 1, 0, 1, 1, 0, 1, 1, 1, 1, 1, 0, 0, 1, 0, 1, 0, 1, 1,
1, 1, 1, 0, 1, 1, 0, 1, 0, 1, 0, 0, 1, 1, 1, 0, 1, 1, 1, 1, 1, 1,
1, 1, 1, 1, 1, 0, 1, 0, 0, 1, 1, 1, 1, 1, 1, 1, 1, 1, 1, 1, 1, 1,
1, 1, 1, 1, 1, 1, 1, 1, 1, 1, 1, 1, 0, 0, 0, 0, 0, 0, 1])
rfc = RandomForestClassifier(n_estimators=100, random_state=90)
score_pre = cross_val_score(rfc, data.data, data.target, cv=10).mean()
score_pre
0.9648809523809524
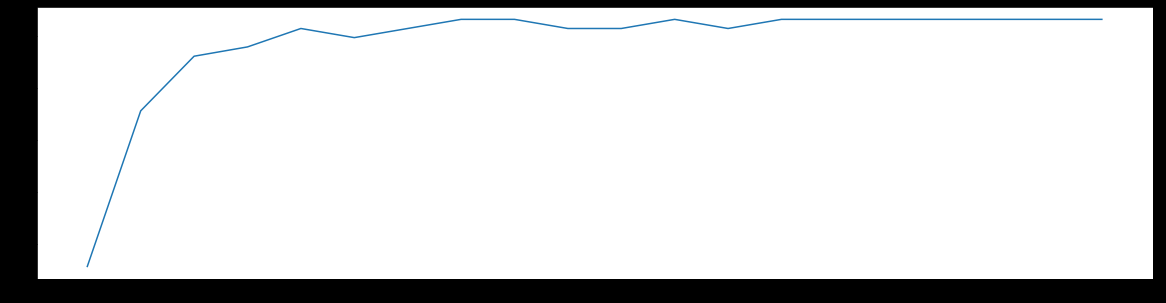
score1 = []
for i in range(0, 200, 10):
    rfc = RandomForestClassifier(n_estimators=i+1,
                                n_jobs=-1,
                                random_state=90)
    score = cross_val_score(rfc, data.data, data.target, cv=10).mean()
    score1.append(score)
print(max(score1), (score1.index(max(score1)) + 10) + 1)
plt.figure(figsize=[20, 5])
plt.plot(range(1, 201, 10), score1)
plt.show()
0.9631265664160402 18
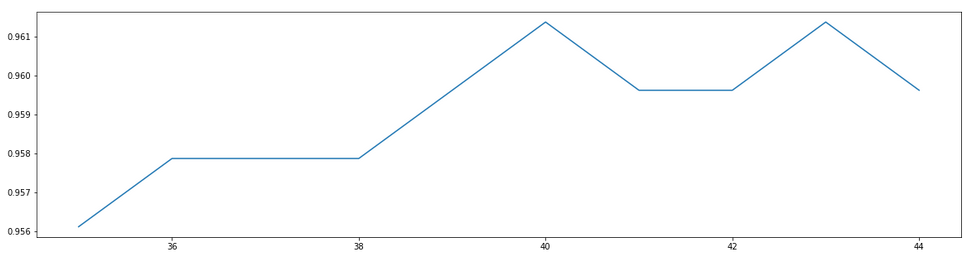
score1 = []
for i in range(35, 45):
    rfc = RandomForestClassifier(n_estimators=i+1,
                                n_jobs=-1,
                                random_state=90)
    score = cross_val_score(rfc, data.data, data.target, cv=10).mean()
    score1.append(score)
print(max(score1), (score1.index(max(score1)) + 10) + 1)
plt.figure(figsize=[20, 5])
plt.plot(range(35, 45), score1)
plt.show()
0.9613721804511279 16
本文作者: 永生
本文链接: https://yys.zone/detail/?id=221
版权声明: 本博客所有文章除特别声明外,均采用 CC BY-NC-SA 4.0 许可协议。转载请注明出处!
评论列表 (0 条评论)